Macroeconomics, the economy, inflation etc. *likely to be very dull*
Comments
-
You might be right.focuszing723 said:
You supported Clegg though? and by proxy austerity.rick_chasey said:Tbh I was posting on here then so you can look for yourself.
I like to think I’ve been consistent,
Did you ever denounce that stance by Clegg and Liberal Democrats?
You only seem to attribute austerity with the Tories. It also proves that the decision wasn't easy and given the context at the time austerity was deemed necessary by the experts.
I do think that sometimes, history is great, but it's difficult to bring context to the situation at the time. I keep coming back to "easy with hindsight".
I don't know, interesting.
I'm inclined to blame the bad sh!t on the tories and the good stuff on the lib dems, but then that's coalition politics.
I think the truth is probably somewhere in the middle, and ultimately the Lib dems did swallow the tory line on austerity, and tried to make gains within that framework.
They were very much the minority part, so I think their view was if they're going to do austerity, they need to protect the low earners, and the rise of the tax free allowance was their bit.0 -
OK. As promised, here is a example of why your links are not convincing me. I picked this one from your list at random:rick_chasey said:Right. And the other links and statements? I feel like the level of assertion you need is for you to be taken step-by-step by a trained economist through the numbers, which is a level I cannot attain.
What is it about the economists above that you find unconvincing?
https://neweconomics.org/2019/02/austerity-hitting-uk-economy-by-almost-100bn-this-year-more-than-3-600-per-household
There's no evidence to back up the claims in this link, but under "Notes to Editors" there is this link:
https://neweconomics.org/2019/02/austerity-is-subduing-uk-economy-by-more-than-3-600-per-household-this-year
There are further claims in this link, unsupported by evidence in the link, but there is a further link to the OBR:
https://obr.uk/fer/forecast-evaluation-report-december-2018/
This provides yet more links, with the first on the list being to a Forecast Evaluation Report from December 2018:
https://obr.uk/docs/dlm_uploads/Forecast-Evaluation-Report-2018_Web_Accessible.pdf
This covers three areas:
Box 2.1 on p15 - revised GDP growth stats, which actually show that annual GDP growth from 2010 to 2017 ranged between 1.4% and 2.5%, though this isn't looking at the impact of austerity, it is just re-stating stats.
Boxes 2.2 and 3.1 on p25 and p36 cover growth and public finance impacts of the 2016 EU referendum.
To summarise:
- Firstly, one can legitimately ask the question "Who on earth are the New Economics Foundation?" They are hardly mainstream, and could be as bigger bunch of chancers as the IEA.
- Secondly, one has to chug through a lot of links to find any analysis rather than unjustified assertions
- Thirdly, when one does get to the OBR analysis, it covers a completely different time period in its main analysis (2016 onwards rather than the austerity years) and it covers a completely different factor (EU referendum rather than austerity)
There may be a valid case to be made that austerity hampered the UK economy relative to a looser fiscal policy over the same period, from the same starting point, but your initial link certainly doesn't make it. In fact, per "thirdly" above, it makes a completely different point and doesn't even address the claim it actually makes initially.
Links may be out of date I guess and now point to other articles than those originally referenced, but this feels a somewhat charitable viewpoint.
Maybe I'm unrealistic, but you would ideally post links to docs that back up the specific claim you're making explicitly, rather than making general claims from which you extrapolate or provide backup via links to other docs. Having to follow links is a PITA, and if you're making the claim you should really take the "P" in your "A". And if you do link articles that themselves link articles, the final link has to cover the initial claim made!0 -
Right.
So when I posted the first load of links, I made a point of using specifically neutral organisations so that we avoid the "they're just a bias think tank" argument. But you felt they didn't point to a specific number for the UK.
There is reason for that; specifically, neutral organisations like the OBR etc will not make those specific counter-factuals about the success or failure of certain policies because they want to avoid getting stuck into politics, which that would do.
OBR does not want to be in a position where the are saying "x policy cost people loads of money". So it won't go that far.
The only organisations that will are those advocating a certain policy. You won't escape that. Unless you want to do it yourself. I can't - I'm not trained that way
The problem with any economic evaluation of any policy is, as you rightly point out, the counter-factual is always pulling some number out of your @rse, and there will always be specific circumstances people can point to to say whatever assumptions you made in your counter-factual, they are wrong. A counter factual is by definition wrong, as it never happened.
Right?
So we can get into the esoteric of the epistemology and philosophy of economic history if you want, but that won't get us very far, not least as, I at the very least, have absolutely no training in that.
What I can say, is that just speaking to economists for a living, listening to them, reading them, they all make it clear austerity was a policy failure.
So when, a well respected economist in a peer reviewed academic journal says this here: https://academic.oup.com/pa/article/68/suppl_1/154/1403373?login=falseMost macroeconomists now agree that the austerity programme pursued by the Coalition Government in its first two years was both too severe and unnecessary and set back the economic recovery which was underway in the first half of 2010. The Office of Budget Responsibility confirmed that the austerity programme reduced GDP, while the Oxford economist Simon Wren-Lewis has calculated that the Coalition Government's austerity programme cost the average household £4000 over the lifetime of the Parliament and severely damaged those public services which were not ring-fenced
I take that as read.
If that's not enough for you, that's fine, but I can't do any more to persuade you.
I suspect austerity was quite a popular policy at the time and so a lot of people want it to be right.
Plus there is the whole macro-finance isn't private finance but it's easier to explain argument, blah blah.0 -
It reminds me a bit of the diet thread you created. Rather than deal with the underlying route of the problem (exercise/food intake). People are put on a magic pill to address the issue, then they can carry on blissfully.
Historic IR lows have been the drug of choice, cheap debt.
1 -
And yet you seem to believe that historically frequently occurring events could not be predicted or planned for.focuszing723 said:It reminds me a bit of the diet thread you created. Rather than deal with the underlying route of the problem (exercise/food intake). People are put on a magic pill to address the issue, then they can carry on blissfully.
Historic IR lows have been the drug of choice, cheap debt.1985 Mercian King of Mercia - work in progress (Hah! Who am I kidding?)
Pinnacle Monzonite
Part of the anti-growth coalition0 -
The IMF article in the link and a chart0 -
I like the term "fiscal consolidations".0
-
I CBA to read the whole article so can you help me out on the definition of “fiscal consolidation” please? Eg real terms reduction in public expenditure, absolute cuts in public expenditure etc.rick_chasey said:
The IMF article in the link and a chart
The reason I ask is that in the first 3-4 years of the Coalition, the deficit averaged circa 7% of GDP so it’s not obvious that fiscal consolidation, or even “austerity” took place in the U.K. during that period
despite the media hype.
And how is the impact assessed? eg the actual change in debt to GDP from year to year or the difference between the actual debt to GDP and its (counter-factually) estimated equivalent in a parallel universe where there isn’t fiscal consolidation (however defined)?
Thanks!
0 -
I like “on average”.focuszing723 said:I like the term "fiscal consolidations".
0 -
Trump used fiscal stimulus to keep the economy growing at 3%, when the taps were turned off so was growth.
Genuine question - is there such a thing as good and bad growth?
If you borrow 3% of GDP and economy only grows 3% then either the accelerato is broken or the economy is in long term decline0 -
If you borrow at 3% of GDP and the economy then grows by 3%, that debt is now a lower proportion of GDP.surrey_commuter said:Trump used fiscal stimulus to keep the economy growing at 3%, when the taps were turned off so was growth.
Genuine question - is there such a thing as good and bad growth?
If you borrow 3% of GDP and economy only grows 3% then either the accelerato is broken or the economy is in long term decline0 -
2nd paragraph in the intro in the chapterwallace_and_gromit said:
I CBA to read the whole article so can you help me out on the definition of “fiscal consolidation” please? Eg real terms reduction in public expenditure, absolute cuts in public expenditure etc.rick_chasey said:
The IMF article in the link and a chart
The reason I ask is that in the first 3-4 years of the Coalition, the deficit averaged circa 7% of GDP so it’s not obvious that fiscal consolidation, or even “austerity” took place in the U.K. during that period
despite the media hype.
And how is the impact assessed? eg the actual change in debt to GDP from year to year or the difference between the actual debt to GDP and its (counter-factually) estimated equivalent in a parallel universe where there isn’t fiscal consolidation (however defined)?
Thanks!This chapter examines policy options for reducing
debt ratios, including the effects of fiscal consolidation
(increases in primary balances), growth, and inflation.
They're talking about moving to a position where the net spend/tax position is moving towards a more positive one.
In terms of the impact, they're basically comparing countries that engaged in 'fiscal consolidation' to address the public debt to GDP ratio, and those that didn't.
So it's not a counter factual, but just taking what actually happened and stacking them up against each other.
As it says in the article:In the end, countries’ choices will depend
on a complex set of factors, including domestic and
external conditions, as well as on the fact that not
all alternatives may always be available.
So it looks at everything around the world > hence talk of averages. It's a much better data set as a result, and irons out the natural variance.0 -
could you pretend that I am sh1t at maths and explain why the proporton has not styaed exactly the samerick_chasey said:
If you borrow at 3% of GDP and the economy then grows by 3%, that debt is now a lower proportion of GDP.surrey_commuter said:Trump used fiscal stimulus to keep the economy growing at 3%, when the taps were turned off so was growth.
Genuine question - is there such a thing as good and bad growth?
If you borrow 3% of GDP and economy only grows 3% then either the accelerato is broken or the economy is in long term decline0 -
-

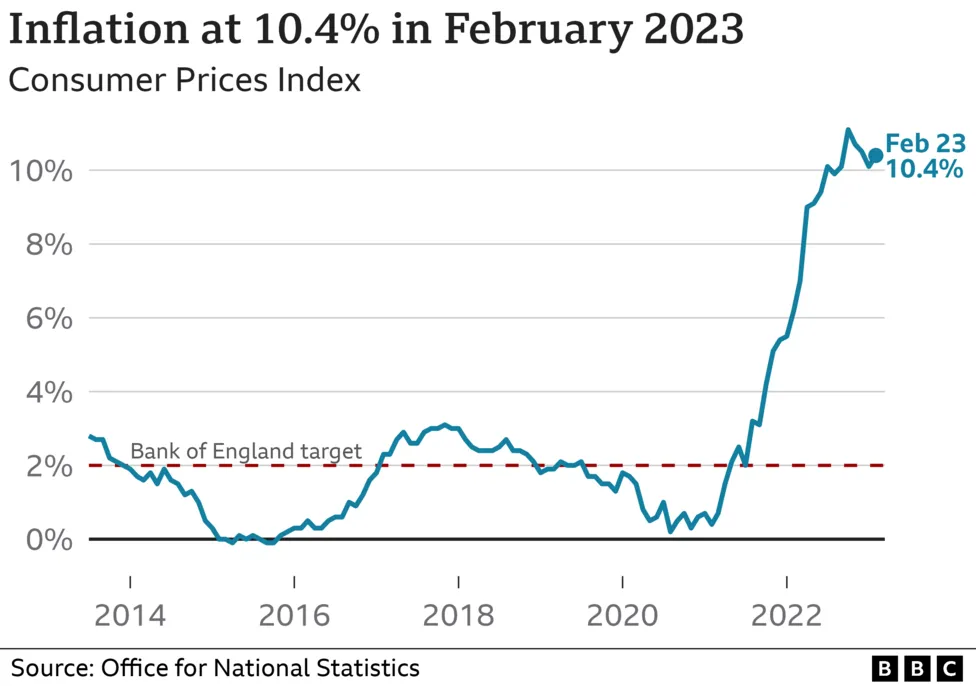 During the observation period from 1960 to 2021, the average inflation rate was 5.1% per year. Overall, the price increase was 1,894.04%. An item that cost 100 pounds in 1960 costs 1,994.04 pounds at the beginning of 2022. For February 2023, the year-over-year inflation rate was 9.2%.https://www.worlddata.info/europe/united-kingdom/inflation-rates.php#:~:text=During the observation period from,year inflation rate was 9.2%.
There's inflation to take into consideration too.0 -
Thanks. Over what period do you think this should be considered? I assume you’re approaching the “Austerity was bad economically” argument again. The UK’s debt to gdp ratio started falling in the financial year 2017/18, so the assessment period must be 6 years or less.rick_chasey said:
2nd paragraph in the intro in the chapterwallace_and_gromit said:
I CBA to read the whole article so can you help me out on the definition of “fiscal consolidation” please? Eg real terms reduction in public expenditure, absolute cuts in public expenditure etc.rick_chasey said:
The IMF article in the link and a chart
The reason I ask is that in the first 3-4 years of the Coalition, the deficit averaged circa 7% of GDP so it’s not obvious that fiscal consolidation, or even “austerity” took place in the U.K. during that period
despite the media hype.
And how is the impact assessed? eg the actual change in debt to GDP from year to year or the difference between the actual debt to GDP and its (counter-factually) estimated equivalent in a parallel universe where there isn’t fiscal consolidation (however defined)?
Thanks!This chapter examines policy options for reducing
debt ratios, including the effects of fiscal consolidation
(increases in primary balances), growth, and inflation.
They're talking about moving to a position where the net spend/tax position is moving towards a more positive one.
In terms of the impact, they're basically comparing countries that engaged in 'fiscal consolidation' to address the public debt to GDP ratio, and those that didn't.
So it's not a counter factual, but just taking what actually happened and stacking them up against each other.
As it says in the article:In the end, countries’ choices will depend
on a complex set of factors, including domestic and
external conditions, as well as on the fact that not
all alternatives may always be available.
So it looks at everything around the world > hence talk of averages. It's a much better data set as a result, and irons out the natural variance.
You’re implicitly saying that had the U.K. borrowed more post-2010 then debt to gdp would have started falling earlier than 2017/18, despite the greater borrowing. What pattern of deficits would have been achieved post-2010 without fiscal consolidation, do you think? Borrowing in 2009/10 was 10% of gdp so I assume you’d have carried on at that level had you been in charge.
0 -
Real gross domestic product (GDP) is an inflation-adjusted measure that reflects the value of all goods and services produced by an economy in a given year. Real GDP is expressed in base-year prices. It is often referred to as constant-price GDP, inflation-corrected GDP, or constant-dollar GDP.https://www.investopedia.com/terms/r/realgdp.asp#:~:text=Real gross domestic product (GDP) is an inflation-adjusted,, or constant-dollar GDP.0
-
Well I think austerity is bad for lots of things (for obvious reasons), but the one thing it is supposed to be good for is managing the debt/gdp ratio, to avoid the government running up unmanageable debts and defaulting, which will cause much more extreme spending cuts!
So if it's not even a given that it even will change the debt/gdp ratio, it begs the question why it should be considered.
And in answer to your question, a) i don't know as i'm not a trained economist, but b) the general thesis is that the gdp/debt ratio would be either the same or improve because the gdp side of the equation would grow more than the debt side without austerity. Beacuse, in general, austerity analysis back in 2010 underestimated the cost of cutting various public services and the multiplier effect of government spending (which disproportionately helps lower income people who naturally have a higher multiplier effect)
Clearly doing stupid things like Brexit harm both sides of the equation.
The US is a helpful shorthand comparision for what happens when you *don't* do austerity post GFC > and they had a much deeper recession.0 -
If debt vs gdp is less than 100% then a one-off “borrow to generate growth” increases debt as % of gdp.rick_chasey said:2022 GDP is 100
2022 borrowing is 3
2023 gdp is 103
3/103 is not 3, but 2.9.
If it’s >100% then it’s the other way round.
Eg debt is 80. GDP is 100.
3% borrowing increases debt to 83 and gdp to 103. (Assuming one-off impact.)
83/103 > 80/100.
Conversely,
123/103 > 120/100.
Inflation confuses the matter as with non-zero inflation, debt to gdp ratios fall if there is no deficit or surplus.
0 -
2022: GDP = 100 and debt = 100 means debt is 100% of GDPrick_chasey said:2022 GDP is 100
2022 borrowing is 3
2023 gdp is 103
3/103 is not 3, but 2.9.
2023 Deficit is 3, GDP is 103 and debt is 103 means debt is 100% of GDP0 -
-
fixed in what sense?rick_chasey said:Debt is fixed though, right?
0 -
If I borrow £1bn at 1% over 10 years I’m paying back £100m plus interest over the 10 year duration regardless of economic performance. So if you have loads of growth, that £1bn is a much lower proportion of GDP come the end of the loan.surrey_commuter said:
fixed in what sense?rick_chasey said:Debt is fixed though, right?
0 -
I think I have finally cracked the nut of why you and I don't agree on debt.rick_chasey said:
If I borrow £1bn at 1% over 10 years I’m paying back £100m plus interest over the 10 year duration regardless of economic performance. So if you have loads of growth, that £1bn is a much lower proportion of GDP come the end of the loan.surrey_commuter said:
fixed in what sense?rick_chasey said:Debt is fixed though, right?
If you sell a £1bn 10 year gilt with a coupon rate of £10pa (ie borrow £1bn at 1%) then you will pay an annual coupon but not pay any of the capital back. After 10 years you will either un a surplus and pay it back or you will sell another bond for £1bn at the prevailing rate.
Your way what happens in 10 years does not matter, my way in the end your luck will run out and your debt servicing costs quadruple.
What you have to do is look at the annual deficit ten years ago and hope it ws not too high as that will indicate your likely scale of refinancing 0
0 -
Whatever, logic still applies.
It’s called fixed income for a reason.
In macroeconomics you always roll it over because there is always a future. You don’t get mortgages in macro because nations can’t die like that.0 -
I think SC's point was that the future might be very expensive in terms of interest cost when rolling over takes place.rick_chasey said:In macroeconomics you always roll it over because there is always a future.
There's also the point that the if the bond markets lose faith in the incumbent government then interest rates rise and asset liability mismatches (which ideally shouldn't exist but do) can pop up and cause all sorts of problems e.g. UK pension schemes in the aftermath of the Truss budget (this issue developed very quickly) and then SVB more recently (which happened more slowly).
0 -
The LDI piece was rather specific but yes, your broader point is right, that when the GDP/Public debt ratio gets too wide, that creates massive problems. That's why the IMF study is interesting, as it looks at what is an effective way for a gov't to reduce the ratio. Turns out, austerity is often not the answer..!wallace_and_gromit said:
I think SC's point was that the future might be very expensive in terms of interest cost when rolling over takes place.rick_chasey said:In macroeconomics you always roll it over because there is always a future.
There's also the point that the if the bond markets lose faith in the incumbent government then interest rates rise and asset liability mismatches (which ideally shouldn't exist but do) can pop up and cause all sorts of problems e.g. UK pension schemes in the aftermath of the Truss budget (this issue developed very quickly) and then SVB more recently (which happened more slowly).
I don't think the UK in 2010s was remotely close to having a Truss moment, and I think in fact (and that oxford journal I linked says the same) that austerity & Brexit made the Truss moment *more likely* not less.
SVB bank was just poorly run and the regulator let them be run badly - I don't think it's relevant to the discussion.0 -
your "whatever" suggests that you don't get the significance in the difference of paying it back over the term of the debt/gilt and rolling it overrick_chasey said:Whatever, logic still applies.
It’s called fixed income for a reason.
In macroeconomics you always roll it over because there is always a future. You don’t get mortgages in macro because nations can’t die like that.
we borrowed on the never never at 1% and my point is that as sure as night follows day that rate will rise to 4% sucking up an ever increasing % of Govt expenditure and there will be nothing we can do about it0 -
post GFC did not come close to a Truss moment because the BofE rather conveniently bought all the debt. Truss would not have had a Truss moment if QE was still going full throttle.rick_chasey said:
The LDI piece was rather specific but yes, your broader point is right, that when the GDP/Public debt ratio gets too wide, that creates massive problems. That's why the IMF study is interesting, as it looks at what is an effective way for a gov't to reduce the ratio. Turns out, austerity is often not the answer..!wallace_and_gromit said:
I think SC's point was that the future might be very expensive in terms of interest cost when rolling over takes place.rick_chasey said:In macroeconomics you always roll it over because there is always a future.
There's also the point that the if the bond markets lose faith in the incumbent government then interest rates rise and asset liability mismatches (which ideally shouldn't exist but do) can pop up and cause all sorts of problems e.g. UK pension schemes in the aftermath of the Truss budget (this issue developed very quickly) and then SVB more recently (which happened more slowly).
I don't think the UK in 2010s was remotely close to having a Truss moment, and I think in fact (and that oxford journal I linked says the same) that austerity & Brexit made the Truss moment *more likely* not less.
SVB bank was just poorly run and the regulator let them be run badly - I don't think it's relevant to the discussion.0 -