Sky are dopers - Oh no they're not
Comments
-
Above The Cows wrote:ALIHISGREAT wrote:Above The Cows wrote:Can people stop using such foul language.
As for Laurens Ten Dam's Strava Data. Max heart rate of 179? Up Ventoux? My god these people are freaks. 179? I'd be hitting 190 if I was putting in those efforts.
You are a woman though... so you naturally have a higher HR.
Aye that is true. We need that extra effort to shift our higher body fat percentage. 'S'not fair. :x
My 3 day old baby girl has a rest HR of 130, 220 if she gets mad. My numbers are 40 and 180.
If you're healthy and fit ATC, i reckon you're 30-35 of age?!0 -
We're in danger of confusing passion with incompetence
- @ddraver0 -
-
rickyrider wrote:Above The Cows wrote:ALIHISGREAT wrote:Above The Cows wrote:Can people stop using such foul language.
As for Laurens Ten Dam's Strava Data. Max heart rate of 179? Up Ventoux? My god these people are freaks. 179? I'd be hitting 190 if I was putting in those efforts.
You are a woman though... so you naturally have a higher HR.
Aye that is true. We need that extra effort to shift our higher body fat percentage. 'S'not fair. :x
Check Froome's HR from the Vuelta '11 TT http://www.trainingpeaks.com/av/Z3JDD63 ... SXNITPULAE
Now that's a freaky HR... but people have hugely differing natural HRs. A friend of mine regularly gets into the 190s (he's 35) my max is 180 (same age)
He never hit 170! :shock:
My max is 196, I'm 31 (well done skylla). But I can happily hover around 180 for an hour. The worse is when I'm on the cusp of shifting from aerobic to anaerobic. I hate that, makes me feel all funny, once I'm there I'm happy as larry, it's the switch I don't like.Correlation is not causation.0 -
I'm not going to interfere in this discussion but I will have to ask you not to use 'witch hunt'. A swan dies everytime 'witch hunt' gets mentioned.0
-
frenchfighter wrote:
The graph, the graph.... i'm getting deja vu."I have a lovely photo of a Camargue horse but will not post it now" (Frenchfighter - July 2013)0 -
frenchfighter wrote:
Can anybody tell me what that graph means?!0 -
ThomThom wrote:I'm not going to interfere in this discussion but I will have to ask you not to use 'witch hunt'. A swan dies everytime 'witch hunt' gets mentioned.
If swans didn't die we wouldn't have Tchaikovsky's masterpiece Swan Lake.
**Goes back to skinning live kittens**Warning No formatter is installed for the format0 -
Paulie W wrote:frenchfighter wrote:
Can anybody tell me what that graph means?!
The riders on the left went faster than the ones on the right. Up a mountain.0 -
Precisely all the pseudo "scientific" babble that Sir DB alludes to.
After all the crap that has gone on, everyone wants to see clean sport
But there are always going to be cheats (look at athletics this morning)
The real problem is that detection research is very expensive and there is no deep pocketed global corporate funding it.
But I am convinced that science will eventually evolve (through unrelated research) where any chemically enhanced cheating will be obvious. Couple this with life bans as Hoy suggests, then you will be moving towards a serious deterrent.
Everyone is entitled to their own opinions but for me, with Sky I believe I am looking at the result of a heavily crafted training regime with all the marginal gains, some we know and some we (and other teams as yet) don't.
In Froome, I believe I am looking at an exceptional athlete.
I also noted that Greg LeMond endorsed his performance yesterdayaztecboy0 -
i have resisted the urge to go to control panel and start hiding some peoples post, because i was worried about missing some good stuff. but after the last couple of days, my mind is now made up.

contol panel here i come! Van Nicholas Ventus
Rose Xeon RS0 -
r0bh wrote:Paulie W wrote:Can anybody tell me what that graph means?!
Whenever I try to read that guys posts I give up pretty quickly as they don't seem to be written in any recognizable language.
That's kind of what I was alluding to - had to read several posts to get what pVAM and DpVAM represented and still none the wiser where the baseline comes from.0 -
C Froome is not happy - understandably so in my opinion.
http://www.telegraph.co.uk/sport/others ... x-win.htmlCommon sense in an uncommon degree is what the world calls wisdom0 -
The graph...
OK, this is what it is, I've been following.
The basic premiss is using historical data from a known dirty period, and historical data from a period assumed to be cleaner (can't remember the exact periods) to set some target times for a climb. The targets are based on VAM (vertical altitude meters), so don't take into account prevailing weather conditions etc. There is pVAM, which is projected VAM (based on the cleaner period) and DpVAM (projected doped VAM, based on the dirty period).
The projections are made for a climb (there may be some fiddling around to calibrate for specific climbs, I can't remember) and then the climb data is fed into the model.
The differences between the real (estimated) data for a rider and the two projections for the climb are shown (red for the doped projection, blue for the cleaner projection). The differences are that thing called "residuals" that nobody was sure about on a another thread. I'm not sure how the residuals are calculated, some sort of percentage maybe?
Bars over the line = better than projected performance, bars below the line = worse than projected performance.
So the graph purports to show that all riders "measured" did better than projected clean performance, but only Froome did better than projected doped performance.
You can take that with a sack of gritting salt if you like. It's basically your standard statistical trap for any rider performing well. There are most likely huge amounts of estimation involved. There always are.Warning No formatter is installed for the format0 -
Above The Cows wrote:He never hit 170! :shock:
A mate of mine who's done a 48 for a 25miler and an 18 for a 10miler who's heart rate can hit 190 and rests at 40 never goes above about 160 in TTs, I suppose his muscles are getting the oxygen they need anyway... I find it amazing, I TT a 10 and average about 178 and my max is 184.0 -
No tA Doctor wrote:The graph...
OK, this is what it is, I've been following.
The basic premiss is using historical data from a known dirty period, and historical data from a period assumed to be cleaner (can't remember the exact periods) to set some target times for a climb. The targets are based on VAM (vertical altitude meters), so don't take into account prevailing weather conditions etc. There is pVAM, which is projected VAM (based on the cleaner period) and DpVAM (projected doped VAM, based on the dirty period).
The projections are made for a climb (there may be some fiddling around to calibrate for specific climbs, I can't remember) and then the climb data is fed into the model.
The differences between the real (estimated) data for a rider and the two projections for the climb are shown (red for the doped projection, blue for the cleaner projection). The differences are that thing called "residuals" that nobody was sure about on a another thread. I'm not sure how the residuals are calculated, some sort of percentage maybe?
Bars over the line = better than projected performance, bars below the line = worse than projected performance.
So the graph purports to show that all riders "measured" did better than projected clean performance, but only Froome did better than projected doped performance.
You can take that with a sack of gritting salt if you like. It's basically your standard statistical trap for any rider performing well. There are most likely huge amounts of estimation involved. There always are.
Having read a bit further now I'm astonished at the mixing of methodologies: the way in which one set of power estimates feeds out of another set of estimates. If you started to calculate the potential % deviation in this data it would be very high!0 -
So we've moved from Strava power to Max HR as a method of deciding whether someone is natrual or not? LOOOOOOOOOOOOOOOOOOOOL max hr means NOTHING, absoloutley NOTHING.Blog on my first and now second season of proper riding/racing - www.firstseasonracing.com0
-
Here's my chart.
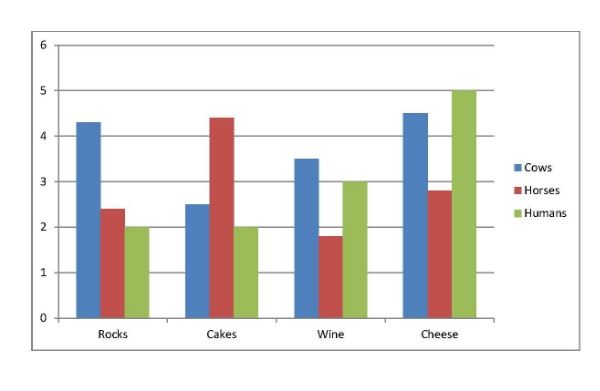 Correlation is not causation.0
 -
Paulie W wrote:No tA Doctor wrote:The graph...
OK, this is what it is, I've been following.
The basic premiss is using historical data from a known dirty period, and historical data from a period assumed to be cleaner (can't remember the exact periods) to set some target times for a climb. The targets are based on VAM (vertical altitude meters), so don't take into account prevailing weather conditions etc. There is pVAM, which is projected VAM (based on the cleaner period) and DpVAM (projected doped VAM, based on the dirty period).
The projections are made for a climb (there may be some fiddling around to calibrate for specific climbs, I can't remember) and then the climb data is fed into the model.
The differences between the real (estimated) data for a rider and the two projections for the climb are shown (red for the doped projection, blue for the cleaner projection). The differences are that thing called "residuals" that nobody was sure about on a another thread. I'm not sure how the residuals are calculated, some sort of percentage maybe?
Bars over the line = better than projected performance, bars below the line = worse than projected performance.
So the graph purports to show that all riders "measured" did better than projected clean performance, but only Froome did better than projected doped performance.
You can take that with a sack of gritting salt if you like. It's basically your standard statistical trap for any rider performing well. There are most likely huge amounts of estimation involved. There always are.
Having read a bit further now I'm astonished at the mixing of methodologies: the way in which one set of power estimates feeds out of another set of estimates. If you started to calculate the potential % deviation in this data it would be very high!
The more you think about it the worse it gets.. its irresponsible pseudo-science motivated by the inflated self-importance of some twitter accounts.
Really makes me angry. I don't mind people asking questions.. but this is just a joke.0 -
I thought everyone on here would have a bike computer pretty much, and go out on familiar routes. Has it never struck some of these people that you comparing speeds with a headwind/will/tailwind takes a couple of glances to see it has massive effect.
The Ventoux is a windy beast as we know, and yesterday, apparently, so it keeps being said, there was a tailwind... I can't remember the last time I watched the Ventoux and it was clearly said there was a tailwind, but there's normally lots of talk of the difficulty of the conditions.
A lot of the times/VAM calculations don't mean anything comparing to most years.
Surely most people have ridden along into a wind thinking 'christ, Im only going 18mph along here I usually go 25' or 'I usually go 20 along here, and am holding 27 with no bother at all'.
I just don't think yesterday's times tell us anything but that there was a good tailwind, as a lot of people went up fast.0 -
My contribution..."I have a lovely photo of a Camargue horse but will not post it now" (Frenchfighter - July 2013)0
-
okgo wrote:So we've moved from Strava power to Max HR as a method of deciding whether someone is natrual or not? LOOOOOOOOOOOOOOOOOOOOL max hr means NOTHING, absoloutley NOTHING.
No I think we were just having a friendly chat about our heart rates and pro-cyclists heart rates. I never meant to suggest that either Ten Dam or Froome were doping by commenting on their heart rates.
But I am a massive cheat, I cheat at Monopoly, I had a highly sophisticated Monopoly cheating programme that enabled me to win for five years and I apologise to my friends and family. In cycling I fuel my achievements through the well known performance enhancers of speculaas and Duvel.Correlation is not causation.0 -
ALIHISGREAT wrote:Paulie W wrote:No tA Doctor wrote:The graph...
OK, this is what it is, I've been following.
The basic premiss is using historical data from a known dirty period, and historical data from a period assumed to be cleaner (can't remember the exact periods) to set some target times for a climb. The targets are based on VAM (vertical altitude meters), so don't take into account prevailing weather conditions etc. There is pVAM, which is projected VAM (based on the cleaner period) and DpVAM (projected doped VAM, based on the dirty period).
The projections are made for a climb (there may be some fiddling around to calibrate for specific climbs, I can't remember) and then the climb data is fed into the model.
The differences between the real (estimated) data for a rider and the two projections for the climb are shown (red for the doped projection, blue for the cleaner projection). The differences are that thing called "residuals" that nobody was sure about on a another thread. I'm not sure how the residuals are calculated, some sort of percentage maybe?
Bars over the line = better than projected performance, bars below the line = worse than projected performance.
So the graph purports to show that all riders "measured" did better than projected clean performance, but only Froome did better than projected doped performance.
You can take that with a sack of gritting salt if you like. It's basically your standard statistical trap for any rider performing well. There are most likely huge amounts of estimation involved. There always are.
Having read a bit further now I'm astonished at the mixing of methodologies: the way in which one set of power estimates feeds out of another set of estimates. If you started to calculate the potential % deviation in this data it would be very high!
The more you think about it the worse it gets.. its irresponsible pseudo-science motivated by the inflated self-importance of some twitter accounts.
Really makes me angry. I don't mind people asking questions.. but this is just a joke.
Agree. The level of "science" in these calculations would get laughed out of a first year undergrad physics lab.0 -
mfin wrote:I thought everyone on here would have a bike computer pretty much, and go out on familiar routes. Has it never struck some of these people that you comparing speeds with a headwind/will/tailwind takes a couple of glances to see it has massive effect.
In the Netherlands I have found wind can have an effect of +/-10 kmph.Correlation is not causation.0 -
NervexProf wrote:C Froome is not happy - understandably so in my opinion.
http://www.telegraph.co.uk/sport/others ... x-win.html
I can understand his frustration if he is clean. Unfortunately he is going to have to put up with it though, especially if you want to put in the performances he is. I do agree though that the journalists need to be more savvy about it and not just asking random/vague questions.
Again he trots out this:
"My team-mates and I have been away from home for months training together and working our arses off to get here, and here I am accused of being a cheat and a liar."
And wtf do you think everyone else is doing Chris?Contador is the Greatest0 -
frenchfighter wrote:NervexProf wrote:C Froome is not happy - understandably so in my opinion.
http://www.telegraph.co.uk/sport/others ... x-win.html
I can understand his frustration if he is clean. Unfortunately he is going to have to put up with it though, especially if you want to put in the performances he is. I do agree though that the journalists need to be more savvy about it and not just asking random/vague questions.
Again he trots out this:
"My team-mates and I have been away from home for months training together and working our arses off to get here, and here I am accused of being a cheat and a liar."
And wtf do you think everyone else is doing Chris?
Sitting at home eating steak?0 -
frenchfighter wrote:NervexProf wrote:C Froome is not happy - understandably so in my opinion.
http://www.telegraph.co.uk/sport/others ... x-win.html
I can understand his frustration if he is clean. Unfortunately he is going to have to put up with it though, especially if you want to put in the performances he is. I do agree though that the journalists need to be more savvy about it and not just asking random/vague questions.
Again he trots out this:
"My team-mates and I have been away from home for months training together and working our arses off to get here, and here I am accused of being a cheat and a liar."
And wtf do you think everyone else is doing Chris?
It isn't that Froome thinks other people aren't also away from home, training hard, working their arses off etc. It's that they are not getting asked the same questions repeatedly, over and over and over and over again.Correlation is not causation.0 -
The problem is, as you say, that the journalist keep trotting out the same lazy general questions time and time again; "What would you say to your critics", "What would you say to people who say you are similar to Armstrong?". It's the same as the classic sports journo question "How do you feel?". There's no decent answer.frenchfighter wrote:I can understand his frustration if he is clean. Unfortunately he is going to have to put up with it though, especially if you want to put in the performances he is. I do agree though that the journalists need to be more savvy about it and not just asking random/vague questions.
Again he trots out this:
"My team-mates and I have been away from home for months training together and working our arses off to get here, and here I am accused of being a cheat and a liar."
And wtf do you think everyone else is doing Chris?
If they started asking specific questions then maybe they might learn something and get better answers, but they don't. The answers are poor because the questions are.
One day someone should turn the tables on the journalists and ask them "What would you say to people who say you are a dishonest, lazy expense account fiddling hack whose sources are at worst fabricated or at best twitter?"Twitter: @RichN950


This discussion has been closed.