Guesstimating Climb time from power

bahzob
Posts: 2,195
If you have access to a power measure and are planning a ride involving lots of climbing or if you just want to measure yourself up against the pros then this application may be of interest.
http://bikecalculator.com/index.html
By plugging in some basic info about yourself and the climb it comes with an estimate of the time to climb. I have found it to be surprisingly accurate. Apart from fun this may also help work out the benefit or otherwise of a bit of new kit or shedding a few pounds
By way of illustration the table below shows some numbers for a variety of different riders on the principal climbs used on the Marmotte. (The "pro" is David Lopez, data from the 2013 TDF stage where they climbed the Alpe twice, shows the difference between "tempo" and taking it "easy")
The difference between actual and calculated is small. Even where they are "wrong", on the Glandon, it illustrates an interesting point. This climb as a vicious little V valley midway up that will slows you up. It is also the first climb in the event so it gets congested and time is lost working your way through the field. Those going faster and/or starting at the front suffer less from this.
Rider ...Kg Climb........ ...Km... %... W...... Mins..Calc Mins...Difference
Pro...... 67 Alpe D'Huez 13....... 8.......360.... 45....... 43....... 2
Pro...... 67 Alpe D'Huez 13....... 8....... 288.... 55........ 52........ 3
RiderA. 74 Alpe D'Huez 13....... 8....... 313.... 54........ 52........ 2
RiderB. 71 Alpe D'Huez 13....... 8....... 222.... 70........ 69........ 1
RiderC. 70 Alpe D'Huez 13....... 8....... 247.... 64........ 65........ -1
RiderD. 70 Alpe D'Huez 13....... 8....... 263.... 58........ 59........ -1
RiderA. 74 Galibier....... 18....... 6.6..... 306.... 66........ 65........ 1
RiderB. 71 Galibier....... 18....... 6.6..... 224.... 84........ 81........ 3
RiderC. 70 Galibier....... 18....... 6.6..... 223.... 82........ 81........ 1
RiderD. 70 Galibier....... 18....... 6.6..... 241.... 74........ 75........ -1
RiderA. 74 Glandon....... 23....... 4.8.... 331.... 64........ 62........ 2
RiderB. 71 Glandon....... 23....... 4.8.... 254.... 83........ 74........ 9
RiderC. 70 Glandon....... 22....... 4.8.... 274.... 74........ 69........ 5
RiderD. 70 Glandon....... 23....... 4.8.... 245.... 81........ 75........ 6
RiderA. 74 Telegraph.... 12....... 6.9.... 335.... 40........ 41........ -1
RiderB. 71 Telegraph.... 12....... 6.9.... 250.... 50........ 51........ -1
RiderC. 70 Telegraph.... 12....... 6.9.... 259.... 50........ 49........ 1
RiderD. 70 Telegraph.... 12....... 6.9.... 241.... 48........ 52........ -4
Martin S. Newbury RC
0
Comments
-
Sob - fatties like me are off the scale.
<puts down the donut>0 -
bahzob wrote:By way of illustration the table below shows some numbers for a variety of different riders on the principal climbs used on the Marmotte. [...] The difference between actual and calculated is small.
RiderA. 74 Telegraph.... 12....... 6.9.... 335.... 40........ 41........ -1
RiderB. 71 Telegraph.... 12....... 6.9.... 250.... 50........ 51........ -1
RiderC. 70 Telegraph.... 12....... 6.9.... 259.... 50........ 49........ 1
RiderD. 70 Telegraph.... 12....... 6.9.... 241.... 48........ 52........ -4
Guesstimating climb time from power should be roughly about as accurate as guesstimating power from climb time. That calculator even has a little headwind-tailwind component, which is essential for getting good estimates. Even so, for the Telegraphe, you can see that the calculator estimated longer times for a given power than actually observed -- in one case, 4 minutes error in a prediction of 52 minutes, or an error of about 8%. That 8% error may be unusually large but it does happen, and when you compare RiderD's times on the other climbs you can see that a rider who is "slow" on one climb can be "fast" on another.
This illustrates an interesting point. Lots of people try to use climbing times or climbing speeds to calculate VAM, which they then use to estimate power. Then they use the estimated power to declare that a rider is either clean or doping. But an 8% error in climbing time given power could just as easily mean an 8% error in power given climbing time. And an 8% error when scaled up to a pro rider in a race could mean something close to a difference of 0.5 watts/kg -- which is much larger than the 0.3 watts/kg difference between a "believably clean" climb at 5.9 watts/kg and a "doped performance" climb at 6.2 watts/kg.0 -
A pro rider on an 8% climb @ 20.6km/h. 5.8W/kg in calm conditions. Line show how much power would actually be required if there were wind.
Error in power estimate from speed or VAM varies with wind speed at rider height. Just for reference, "light air" is not noticeable and requires rising smoke trail to see it, flags don't move. Lightweight flags only begin to extend in a Gentle Breeze.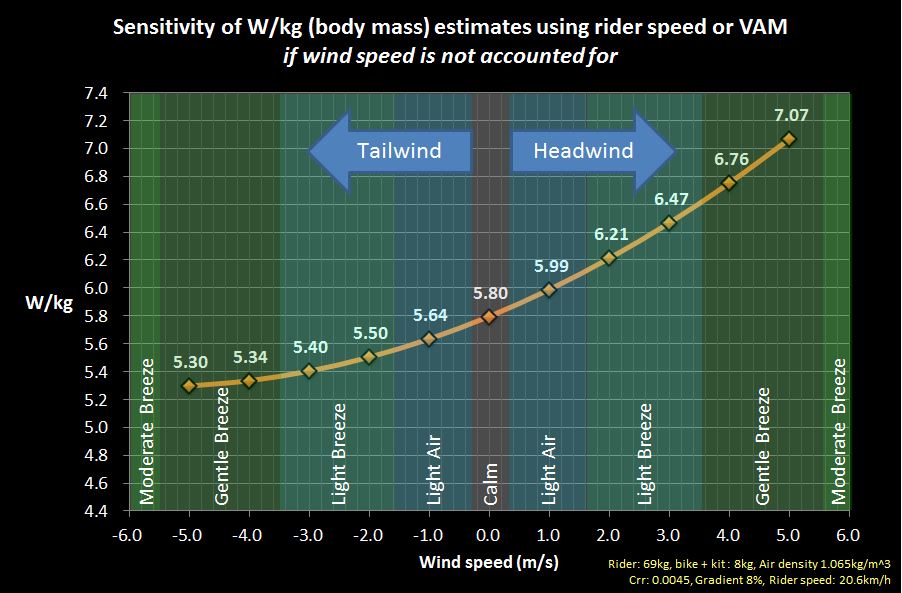
So yeah, use climbing speed as a proxy for power, or power to estimate climbing speeds, but it has its limitations.
I've previous suggested climbs are a low cost homebrew way to track progress:
http://www.bikeradar.com/fitness/articl ... ing-19175/0 -
Using a climb is a pretty consistent and low-cost way to track progress. Sorta like using a one-sided power meter to track progress. Except, of course, for the cost.0
-
Alex_Simmons/RST wrote:
Interesting that the effect is non-linear. The benefit of a 6 m/s tailwind is significantly less than the expense of a 6 m/s headwind. Also surprised how much the power to weight ratio is affected by a moderate wind of 6 m/s (approx 13 mph).
Is this a modelled relationship or derived from real data?0 -
Modelled based on the well validated Martin et al paper.nammynake wrote:Interesting that the effect is non-linear. The benefit of a 6 m/s tailwind is significantly less than the expense of a 6 m/s headwind. Also surprised how much the power to weight ratio is affected by a moderate wind of 6 m/s (approx 13 mph).
Is this a modelled relationship or derived from real data?
It's the same on flat terrain.
Remember that:
- wind speed is not relative to the rider, but to a fixed point. It is a vector and the directional component is defined relative to the direction the rider is travelling (i.e. it's head or tail wind). I'm obviously ignoring any possible minor CdA variability with wind velocity but that assumption applies no matter the terrain
- while on steep climbs the linear component of increasing gravitational potential energy dominates the cubic equation describing the power-speed equation, when extra wind comes into play the cubic component (air resistance) means the relationship loses some of its linearity
- wind speed at rider height is not the same as weather station reported wind speed due to atmospheric boundary layer wind speed gradient. At rider height it's approx half that reported by weather stations using a standard 10 metres above ground recording height0 -
nammynake wrote:Alex_Simmons/RST wrote:
Interesting that the effect is non-linear. The benefit of a 6 m/s tailwind is significantly less than the expense of a 6 m/s headwind. Also surprised how much the power to weight ratio is affected by a moderate wind of 6 m/s (approx 13 mph).
Is this a modelled relationship or derived from real data?
Empirical evidence suggests that a headwind impedes progress more than the equivalent tailwind assists it.
Many a time I've gone out and done a loop with a ferocious headwind on the outward leg and a marvellous wind-assisted sprint home. Average speed is always way down on the same loop in calm conditions.0