Quadrant analysis

chrisw12
Posts: 1,246
Started looking at this and here's some observations, can someone correct me if I'm wrong.
1) When doing a turbo iso power 2x20 all the points are clustered around the center, so I presume that the higher the variability in a ride the more the points will be scattered?
2) When reading up on the subject, I noted that a few people observed that force was the limiter (and is why some people are justifying big gear intervals) . Does this mean that they had too many points in the upper left quadrant, which left them more fatigued?
Putting this together at the moment I presume people use the vi calculation to determine the variability of a ride, but wouldn't a better/different measure be to measure and average out the distances of all the points away from the central point (using Pythag'). The higher this value the more variable the ride. (I've got more on this, just want to start the ball rolling)
As anyone started to do this? If not I'm going to have to think about trade marking it.")
Another observation/use of the quad. analysis, I'd have though would be to determine correct gear choice for fixed wheel riders. I presume people are doing this already?
Just picked this out from Dr C, in response to Alex (a few years ago)
> The higher the VI, the more variable the power output during the ride
> was.
...from a physiological/metabolic perspective, anyway (e.g., 15 s
on/off microintervals entail highly variable power, but the VI will be
very close to one).
Andy Coggan
So vi doesn't always measure the variability, but my suggested method would pick up the variability of the micro intervals?
In fairness to Alex he does respond with:-
Point being - VI is one means of assessing the power demand (and
physiological)characteristics of target events, Quadrant Analysis being
another. '
So has anyone put a number on the QA rather than just looking at it?
1) When doing a turbo iso power 2x20 all the points are clustered around the center, so I presume that the higher the variability in a ride the more the points will be scattered?
2) When reading up on the subject, I noted that a few people observed that force was the limiter (and is why some people are justifying big gear intervals) . Does this mean that they had too many points in the upper left quadrant, which left them more fatigued?
Putting this together at the moment I presume people use the vi calculation to determine the variability of a ride, but wouldn't a better/different measure be to measure and average out the distances of all the points away from the central point (using Pythag'). The higher this value the more variable the ride. (I've got more on this, just want to start the ball rolling)
As anyone started to do this? If not I'm going to have to think about trade marking it.
Another observation/use of the quad. analysis, I'd have though would be to determine correct gear choice for fixed wheel riders. I presume people are doing this already?
Just picked this out from Dr C, in response to Alex (a few years ago)
> The higher the VI, the more variable the power output during the ride
> was.
...from a physiological/metabolic perspective, anyway (e.g., 15 s
on/off microintervals entail highly variable power, but the VI will be
very close to one).
Andy Coggan
So vi doesn't always measure the variability, but my suggested method would pick up the variability of the micro intervals?
In fairness to Alex he does respond with:-
Point being - VI is one means of assessing the power demand (and
physiological)characteristics of target events, Quadrant Analysis being
another. '
So has anyone put a number on the QA rather than just looking at it?
0
Comments
-
Nope, no idea what you just said. Reading that was like listening to Stanley Unwin speaking in the 70s.
Again, but in language suitable for an idiot please? I'm sure it'd be interesting if I knew what the feck it was all about...Litespeed Tuscany, Hope/Open Pro, Ultegra, pulling an Extrawheel trailer, often as not.
FCR 4 (I think?)
Twitter: @jimjmcdonnell0 -
Correct. See here for an example of QA on 2x20s threshold efforts, one performed on my indoor trainer, another at my local training loop:chrisw12 wrote:1) When doing a turbo iso power 2x20 all the points are clustered around the center, so I presume that the higher the variability in a ride the more the points will be scattered?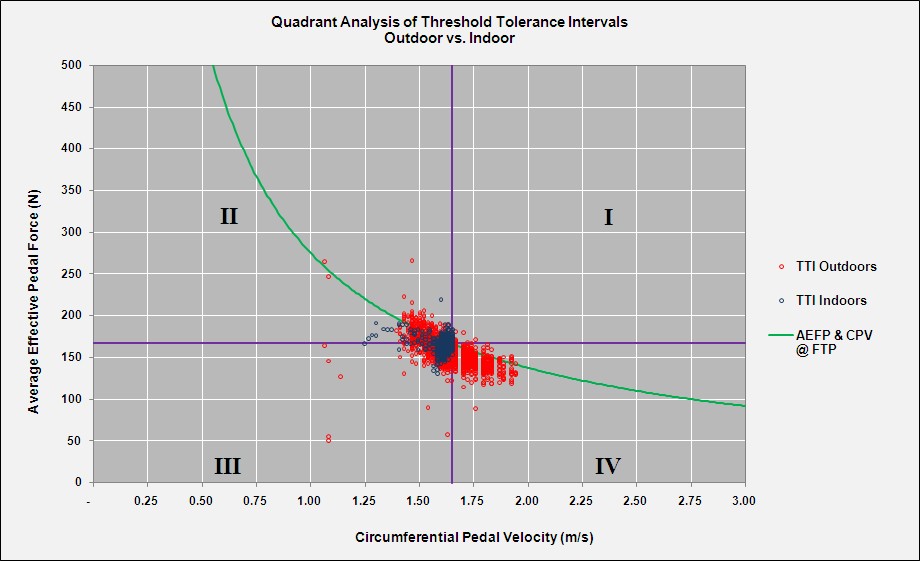
For others - this is from an explanation of Quadrant Analysis:
http://alex-cycle.blogspot.com/2009/01/ ... lysis.html
The maximal AEPF-CPV line is significantly above and to the right of such interval efforts, such that force is not the limiter.chrisw12 wrote:2) When reading up on the subject, I noted that a few people observed that force was the limiter (and is why some people are justifying big gear intervals) . Does this mean that they had too many points in the upper left quadrant, which left them more fatigued?
Also, if one does a QA on such big gear intervals, they will see they are also well inside the max APEF-CPV line, IOW force is not the limiter..
One thing to be careful with using QA is that it's mostly about what you did, rather than would you should do.
I'm going to be doing a blog post about the max AEPF-CPV line sometime soon.
Well it would tell you about the variability in neuromuscular demand, not necessarily metabolic demand.chrisw12 wrote:Putting this together at the moment I presume people use the vi calculation to determine the variability of a ride, but wouldn't a better/different measure be to measure and average out the distances of all the points away from the central point (using Pythag'). The higher this value the more variable the ride. (I've got more on this, just want to start the ball rolling)
As anyone started to do this? If not I'm going to have to think about trade marking it.
Look for items by Dave Harris on this topic.chrisw12 wrote:Another observation/use of the quad. analysis, I'd have though would be to determine correct gear choice for fixed wheel riders. I presume people are doing this already?
I'm not aware if they have but I'm also uncertain of what value it would have.chrisw12 wrote:So has anyone put a number on the QA rather than just looking at it?0 -
I don't care what value it will have. I'm sure someone will find a value, quadrant analysis is going to be big and | want to be like Dr Coggan and put my name on a measurement.
Now I'll have to think of an acronym and look into trademarking it. 0 -
Notice how the blue dots have a different "orientation" than the red dots?Alex_Simmons/RST wrote:See here for an example of QA on 2x20s threshold efforts, one performed on my indoor trainer, another at my local training loop:0 -
So a use then...
Alex, both those rides had a VI of 1? But the red ride has more variability, which my method would show and put a number to it. There's a use, VI misses the variability where as a quadrant analysis number wouldn't.
Anyone know in wko 3 (or other software) if the time spent in each quadrant is reported or the variability of the points from the centre on a quadrant by quadrant basis is reported. Seems to me like a good way of classifying rides/races and tailoring your training.
I'm just thinking out loud here by the way on a pretty new tool, so go easy.0 -
I'm soooooo lost. :shock:
 0
0 -
I think you'll want to take lessons from Carmichael then and not Dr Coggan.chrisw12 wrote:I don't care what value it will have. I'm sure someone will find a value, quadrant analysis is going to be big and | want to be like Dr Coggan and put my name on a measurement.
Now I'll have to think of an acronym and look into trademarking it. 0 -
chrisw12 wrote:wouldn't a better/different measure be to measure and average out the distances of all the points away from the central point (using Pythag').
Different, yes, but better? Not IMHO (as I indicated when it was originally suggested on the wattage list a number of years ago). The points that matter the most in a quadrant analysis plot aren't those that are tightly clustered around the centroid, but rather the outliers, i.e., the moments when you were pedaling at an AEPF and CPV far removed from your "comfort zone". Statistics such as you suggest don't really capture this; you have to see the plot.0 -
RChung wrote:
Notice how the blue dots have a different "orientation" than the red dots?Alex_Simmons/RST wrote:See here for an example of QA on 2x20s threshold efforts, one performed on my indoor trainer, another at my local training loop:
That's because the resistance curves are different on Alex's trainer vs. his loop through the park. Specifically, on the trainer AEPF and CPV tend to increase together, as a result of his temporarily overshooting the set power. In contrast, when riding outdoors AEPF tends to go up as CPV goes down simply because he doesn't have an infinitely variable, instantly reactive transmission.0 -
All the 20-min intervals (there are 2 outdoor and 2 indoor) have an NP/AP ratio of 1.0.chrisw12 wrote:Alex, both those rides had a VI of 1? But the red ride has more variability, which my method would show and put a number to it. There's a use, VI misses the variability where as a quadrant analysis number wouldn't.
Like I said, metabolically, no real difference between these efforts. Neuromuscularly, yes.
The % in each quadrant is reported in 3.0's QA. An average of all points for each QA range selected is also shown, which will give you an indicator of where the centre of mass is.chrisw12 wrote:Anyone know in wko 3 (or other software) if the time spent in each quadrant is reported or the variability of the points from the centre on a quadrant by quadrant basis is reported. Seems to me like a good way of classifying rides/races and tailoring your training.
No problems, always good.chrisw12 wrote:I'm just thinking out loud here by the way on a pretty new tool, so go easy.
Here is same from WKO+ QA (I think they are same rides) to show some of the info on the chart: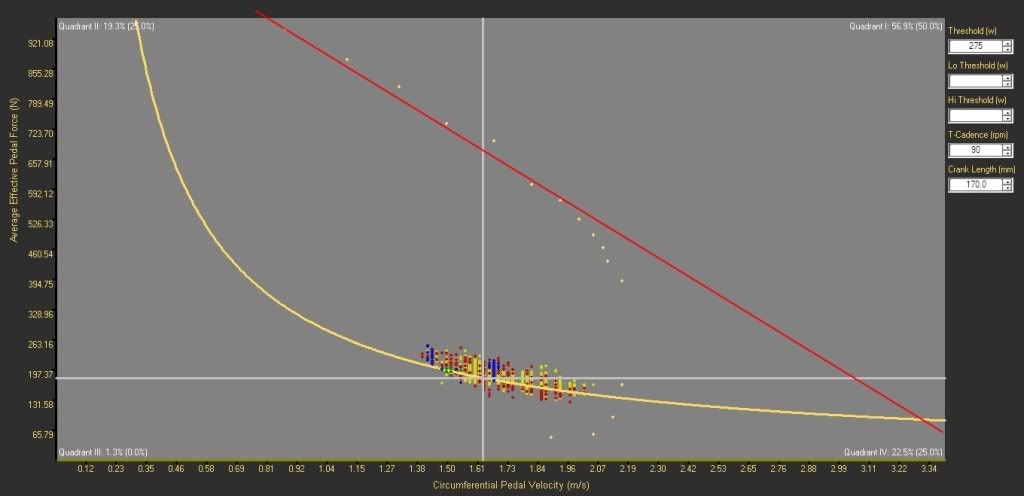
I have also plotted my max AEPF-CPV line using a standing start effort (I have plenty of those but just chose one for simplicity). This is a standing start on a fixed gear track bike and plots the effort from the very low cadence-max force at the start (top left point) through the acceleration as pedal speed goes up (and forces must go down).
This shows a small range of (yellow) dots at the top of the chart and which progress in a linear fashion to the right and down, until neuromuscular fatigue sets in and the relationship loses linearity (happens after ~ 6 seconds or so).
The red line I added myself afterwards and is just an eyeball fit to show the linear relationship, not a computed one.
Note how far away my threshold efforts are from the max AEPF-CPV line.0 -
Power expansion paths?RChung wrote:Notice how the blue dots have a different "orientation" than the red dots?
Or just a reflection of the difference between the gradually variable terrain of outdoor TTI (and perhaps not needing/bothering to change gear all the time) and the relatively high* inertial load of my ergobike.
* compared to most indoor trainers (~30kg flywheel rotating at ~600 rpm).
Edit: I swear I didn't see Andy's comment before posting 0 -
Of course. That's related to why connecting the dots as you were doing earlier doesn't delineate the power expansion path.acoggan wrote:RChung wrote:Notice how the blue dots have a different "orientation" than the red dots?
That's because the resistance curves are different on Alex's trainer vs. his loop through the park.0 -
Not quite, but related. But it illustrates the idea. Even at 30kg, the way Thunderbird's flywheel accelerates doesn't look like the way a bike on the road accelerates.Alex_Simmons/RST wrote:
Power expansion paths?RChung wrote:Notice how the blue dots have a different "orientation" than the red dots?0 -
RChung wrote:
Of course. That's related to why connecting the dots as you were doing earlier doesn't delineate the power expansion path.acoggan wrote:RChung wrote:Notice how the blue dots have a different "orientation" than the red dots?
That's because the resistance curves are different on Alex's trainer vs. his loop through the park.
Au contraire: doing so shows exactly how someone "expands" their power during a particular workout or race. What it doesn't tell you is how they should "expand" their power, as you seem to think can be gleaned from such charts (it can't).0 -
-
Alex_Simmons/RST wrote:I have also plotted my max AEPF-CPV line using a standing start effort
Noice! 0
0 -
Actually, from a complete non-technical cyclist's point of view this is one of the most interesting threads I've read recently, thanks! It's giving me headaches trying to make sense of it, which I perversely like. I don't get much of a chance to learn much any more, this is fun. Not that I'm convinced I understand a significant % of what's being discussed yet but still, it's better than 'what wheels/tyres/gloves/shorts etc should I buy?...
Just one question - red bikes still go faster, right?Litespeed Tuscany, Hope/Open Pro, Ultegra, pulling an Extrawheel trailer, often as not.
FCR 4 (I think?)
Twitter: @jimjmcdonnell0 -
Oh, I agree it's not particularly relevant -- I'm just pointing out that there's nothing in QA that uses centroids no matter what the duration may be so your use of the term can be confusing to people who actually know what a centroid is. Better just to use a neutral descriptive term like "middle" or maybe "center" or even "central mass" which doesn't already have a specific technical definition.acoggan wrote:0 -
Once again you're projecting your lack of knowledge onto others. Please stop that.acoggan wrote:RChung wrote:
Of course. That's related to why connecting the dots as you were doing earlier doesn't delineate the power expansion path.acoggan wrote:RChung wrote:Notice how the blue dots have a different "orientation" than the red dots?
That's because the resistance curves are different on Alex's trainer vs. his loop through the park.
Au contraire: doing so shows exactly how someone "expands" their power during a particular workout or race. What it doesn't tell you is how they should "expand" their power, as you seem to think can be gleaned from such charts (it can't).0